노랑 : 중요 문장 / 빨강 : 새로운 방법 / 초록 : 활용하면 좋은 문장
0. Prior knowledge
In-Distribution (ID) and Out-of-Distribution (OOD)
- In-Distribution (ID): 데이터가 모델이 훈련된 동일한 분포에서 나왔을 때, 이 데이터는 in-distribution으로 간주됩니다. 예를 들어, 모델이 특정 병원의 ECG 데이터로 훈련되었을 때, 같은 병원에서 수집된 새로운 데이터는 ID입니다.
- Out-of-Distribution (OOD): 모델이 처음 보는, 즉 훈련 당시 사용되지 않은 다른 분포의 데이터입니다. 예를 들어, 다른 장비나 다른 환경 조건에서 수집된 데이터가 OOD로 간주될 수 있습니다.
Supervised Learning (SL) vs Self-Supervised Learning (SSL)
- Supervised Learning (SL):
- 데이터와 해당 레이블이 쌍으로 제공됩니다.
- 명확한 지도 하에 특정 작업(예: 분류, 회귀)을 수행하도록 모델을 학습시키는 방법입니다.
- Self-Supervised Learning (SSL):
- 레이블이 명시적으로 주어지지 않습니다.
- 모델이 데이터 내 숨겨진 패턴이나 구조를 스스로 찾아내어 유용한 표현(representation)을 학습하도록 합니다.
Representation Learning
- Representation Learning: 데이터에서 유용한 정보를 자동으로 추출하여, 각종 머신러닝 작업에 쉽게 적용할 수 있는 형태로 변환하는 과정입니다. 목표는 원 데이터보다 처리하기 쉽고, 정보를 더 효율적으로 표현하는 새로운 방법을 찾는 것입니다.

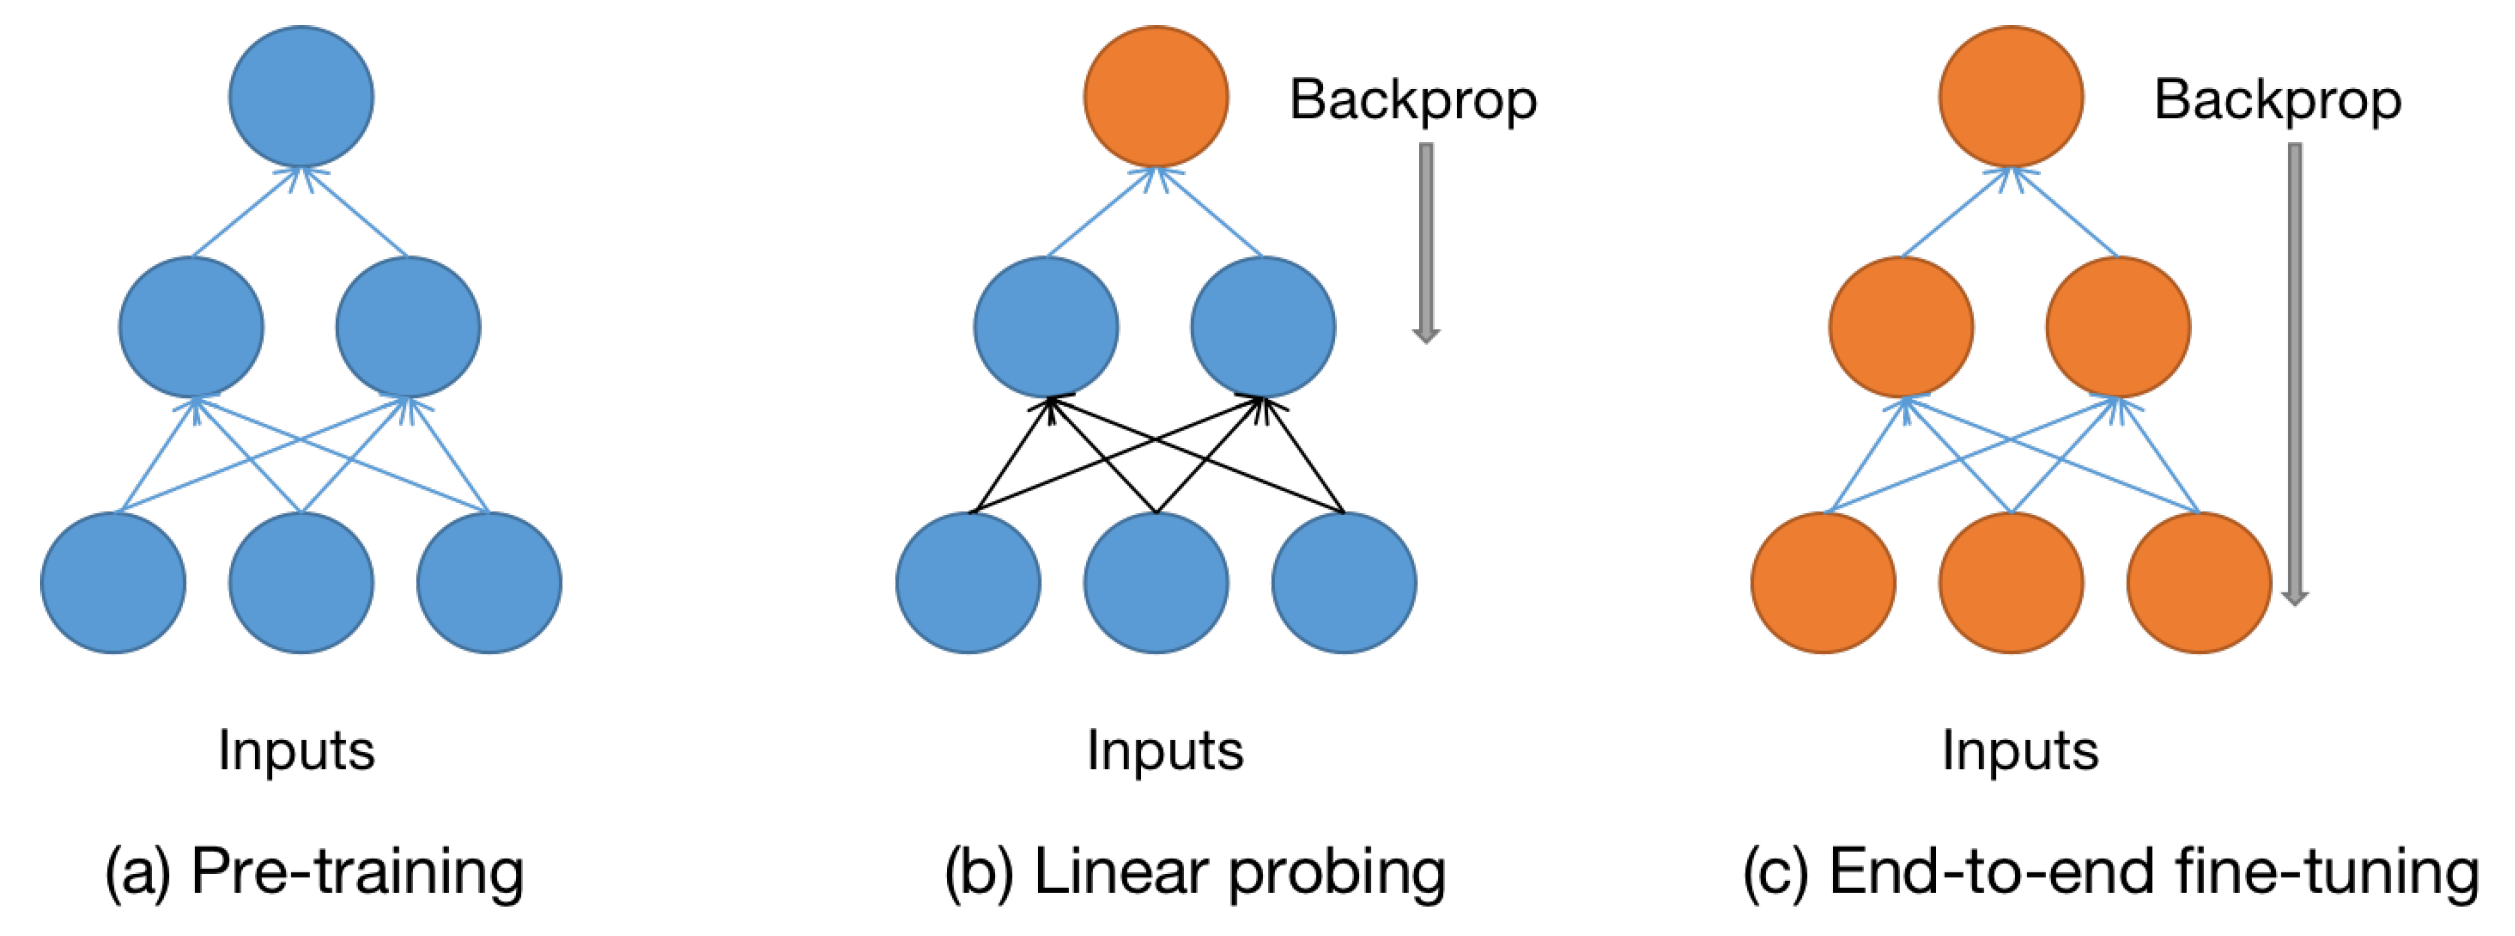
Linear Probing Evaluation
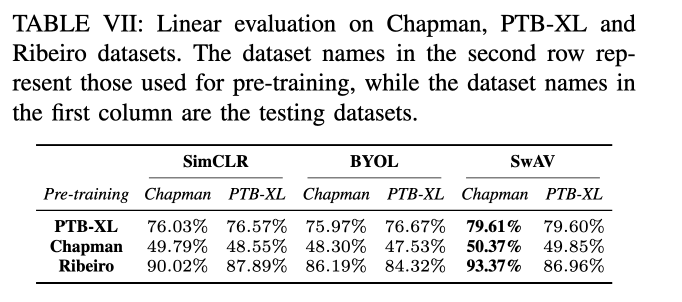
- Linear Probing Evaluation: 사전에 학습된 특징 추출기(예: SSL을 통해 훈련된 신경망)의 효율성을 평가하는 방법 중 하나입니다. 학습된 모델의 출력에 선형 분류기(예: 로지스틱 회귀)를 적용하여, 얼마나 좋은 특징이 학습되었는지를 평가합니다. 이 평가 방법은 미세조정 전에 모델의 표현력을 테스트하는 데 주로 사용됩니다.
Finetuning
- Finetuning: 사전에 훈련된 모델(예: 다른 데이터셋에서 사전 훈련된 모델)을 새로운 작업이나 데이터셋에 적응시키기 위해 추가 학습을 시키는 과정입니다. 미세조정은 일반적으로 사전 훈련된 모델의 가중치를 초기화로 사용하며, 새로운 데이터에 대해 최적화를 진행하여 특정 작업의 성능을 향상시킵니다. 이 과정은 종종 적은 양의 데이터로도 효과적인 학습이 가능하게 합니다.
1. Introduction
심전도 영역에서의 deep learning 기술의 부상 및 한계
- labelling medical datasets is a challenging task as it requires specialized experts with a high level of knowledge in the relevant medical field
- This can lead to unexpected behavior and safety hazards when models are presented with different data that come from different distributions
- However, recent advances in Self-Supervised Learning (SSL) have begun to overcome some of these difficulties
본 연구의 목표 및 내용
- we conduct a comprehensive analysis of SSL techniques for arrhythmia classification from ECG signals
- Our study evaluates the performance of popular self-supervised methods across diverse datasets and assesses their generalizability and OOD classification capabilities.
- we first analyze the distribution of samples using three arrhythmia-based ECG signal datasets, namely PTB-XL, Chapman, and Ribeiro
- Our findings provide valuable insights into the capabilities and limitations of SSL in arrhythmia ECG analysis, opening up promising avenues for future research.
- 적용한 SSL 방법론들
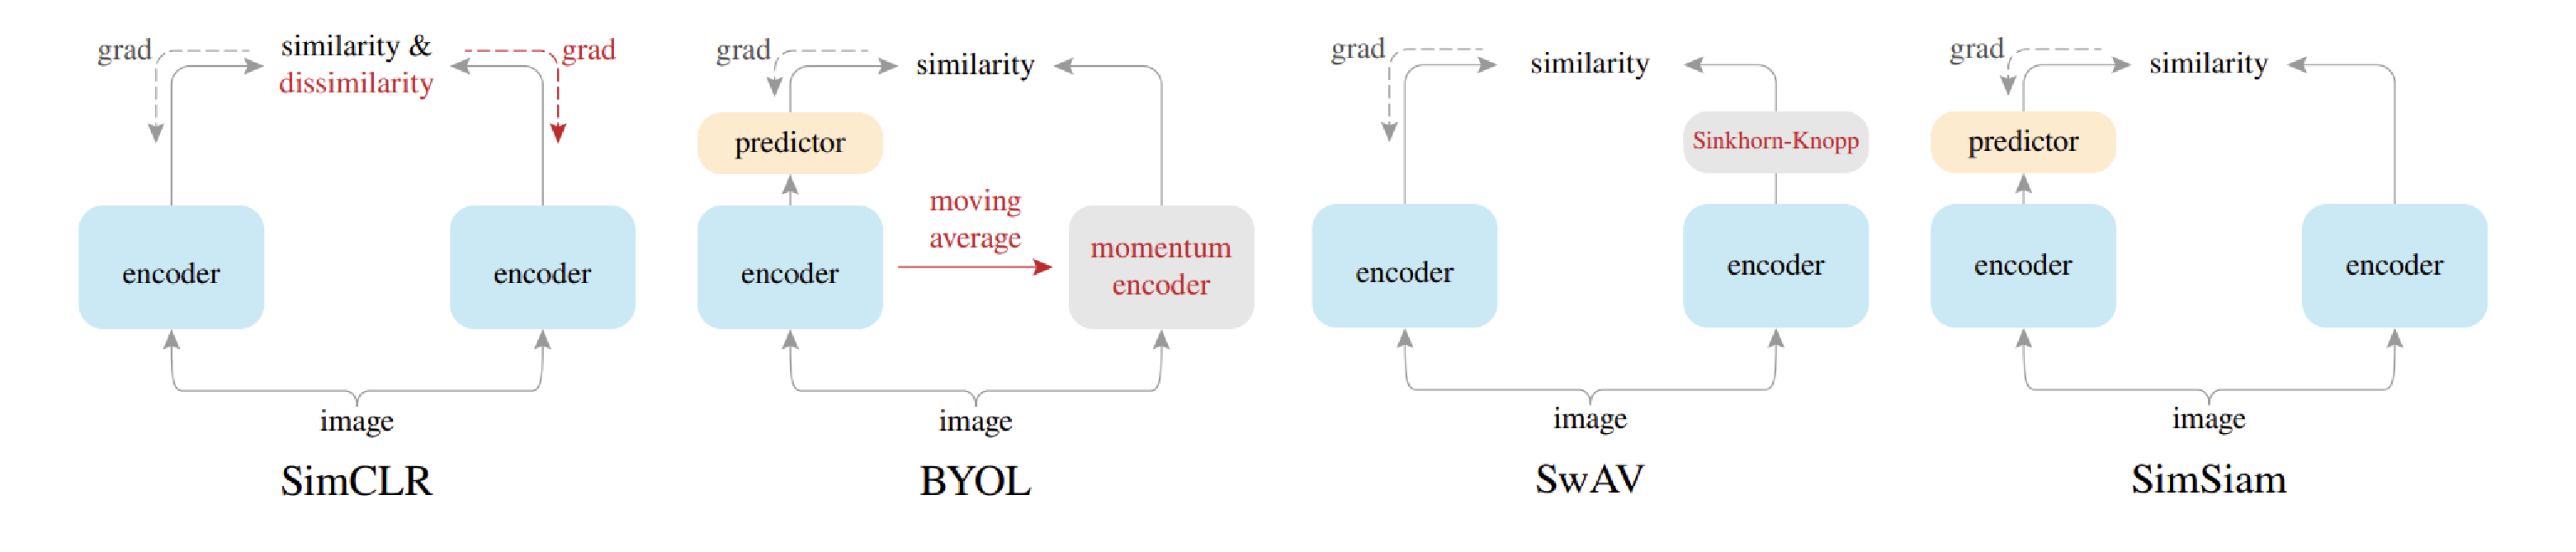
- we select three popular and effective SSL methods, namely Simple Framework for
- Contrastive Learning of Visual Representations (SimCLR), which is a highly popular contrastive learning method,
- Bootstrap Your Own Latent (BYOL), which is a strong method that doesn’t use any negative pairs,
- Swapping Assignments Between Views (SwAV), which utilizes a cluster code book to categorize the features in the datasets
Contributions
- We adapt and implement various SSL techniques and evaluate their effectiveness through a systematic study of various hyper-parameters
- We assess the generalizability of different approaches for handling OOD and ID data.
- We perform a detailed disease-specific investigation on the effects of various SSL methods and associated parameters on different classes of heart disease.
2. Background and literature review
- 여러가지 SSL 논문들을 열거하였으나, 사실 상 마지막 문장이 핵심
- However, existing works often suffer from limitations such as small training datasets affecting model generalizability, insufficient exploration of robustness across diverse data setups and challenges in hyperparameter and augmentation selection
- This is crucial for real-world applications of automated ECG-based arrhythmia classification and robust deployment in clinical settings.
3. Methodology and Experiment setup
A. Self-supervised learning Tech
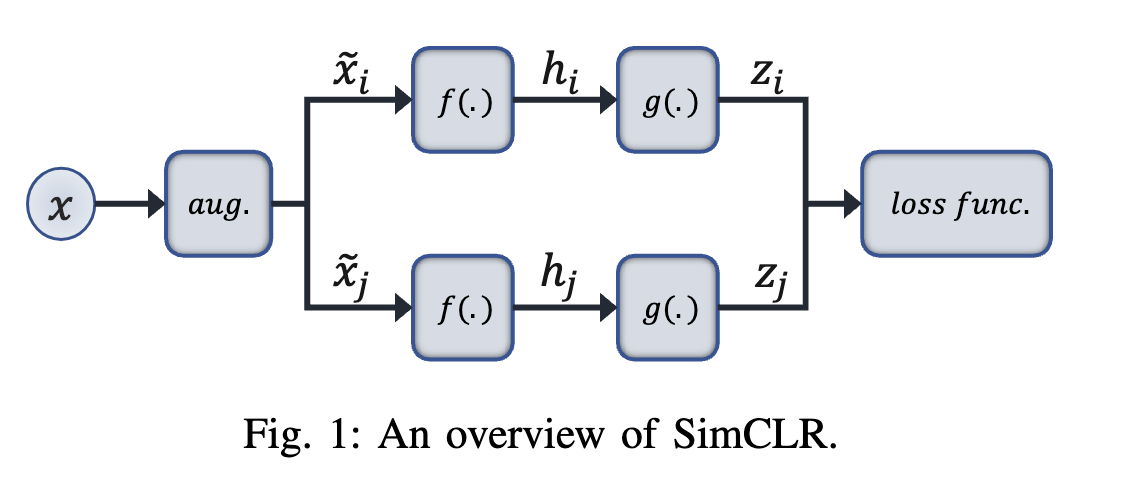
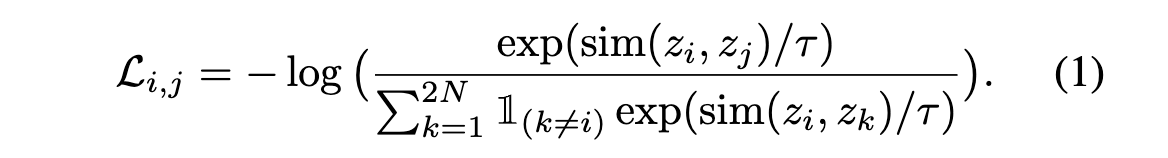
SimCLR : Contrastive based
Contrastive learning is the notion of training a deep learning model by encouraging it to differentiate between pairs of similar and dissimilar data samples. In contrastive learning, the model learns to map samples from the same class closer together in a high-dimensional feature space, while pushing samples from different classes apart. The ultimate goal is to learn representations that capture meaningful features and patterns from the data, which can then be used for downstream tasks such as classification, segmentation, or clustering.
BYOL : Non-Contrastive based
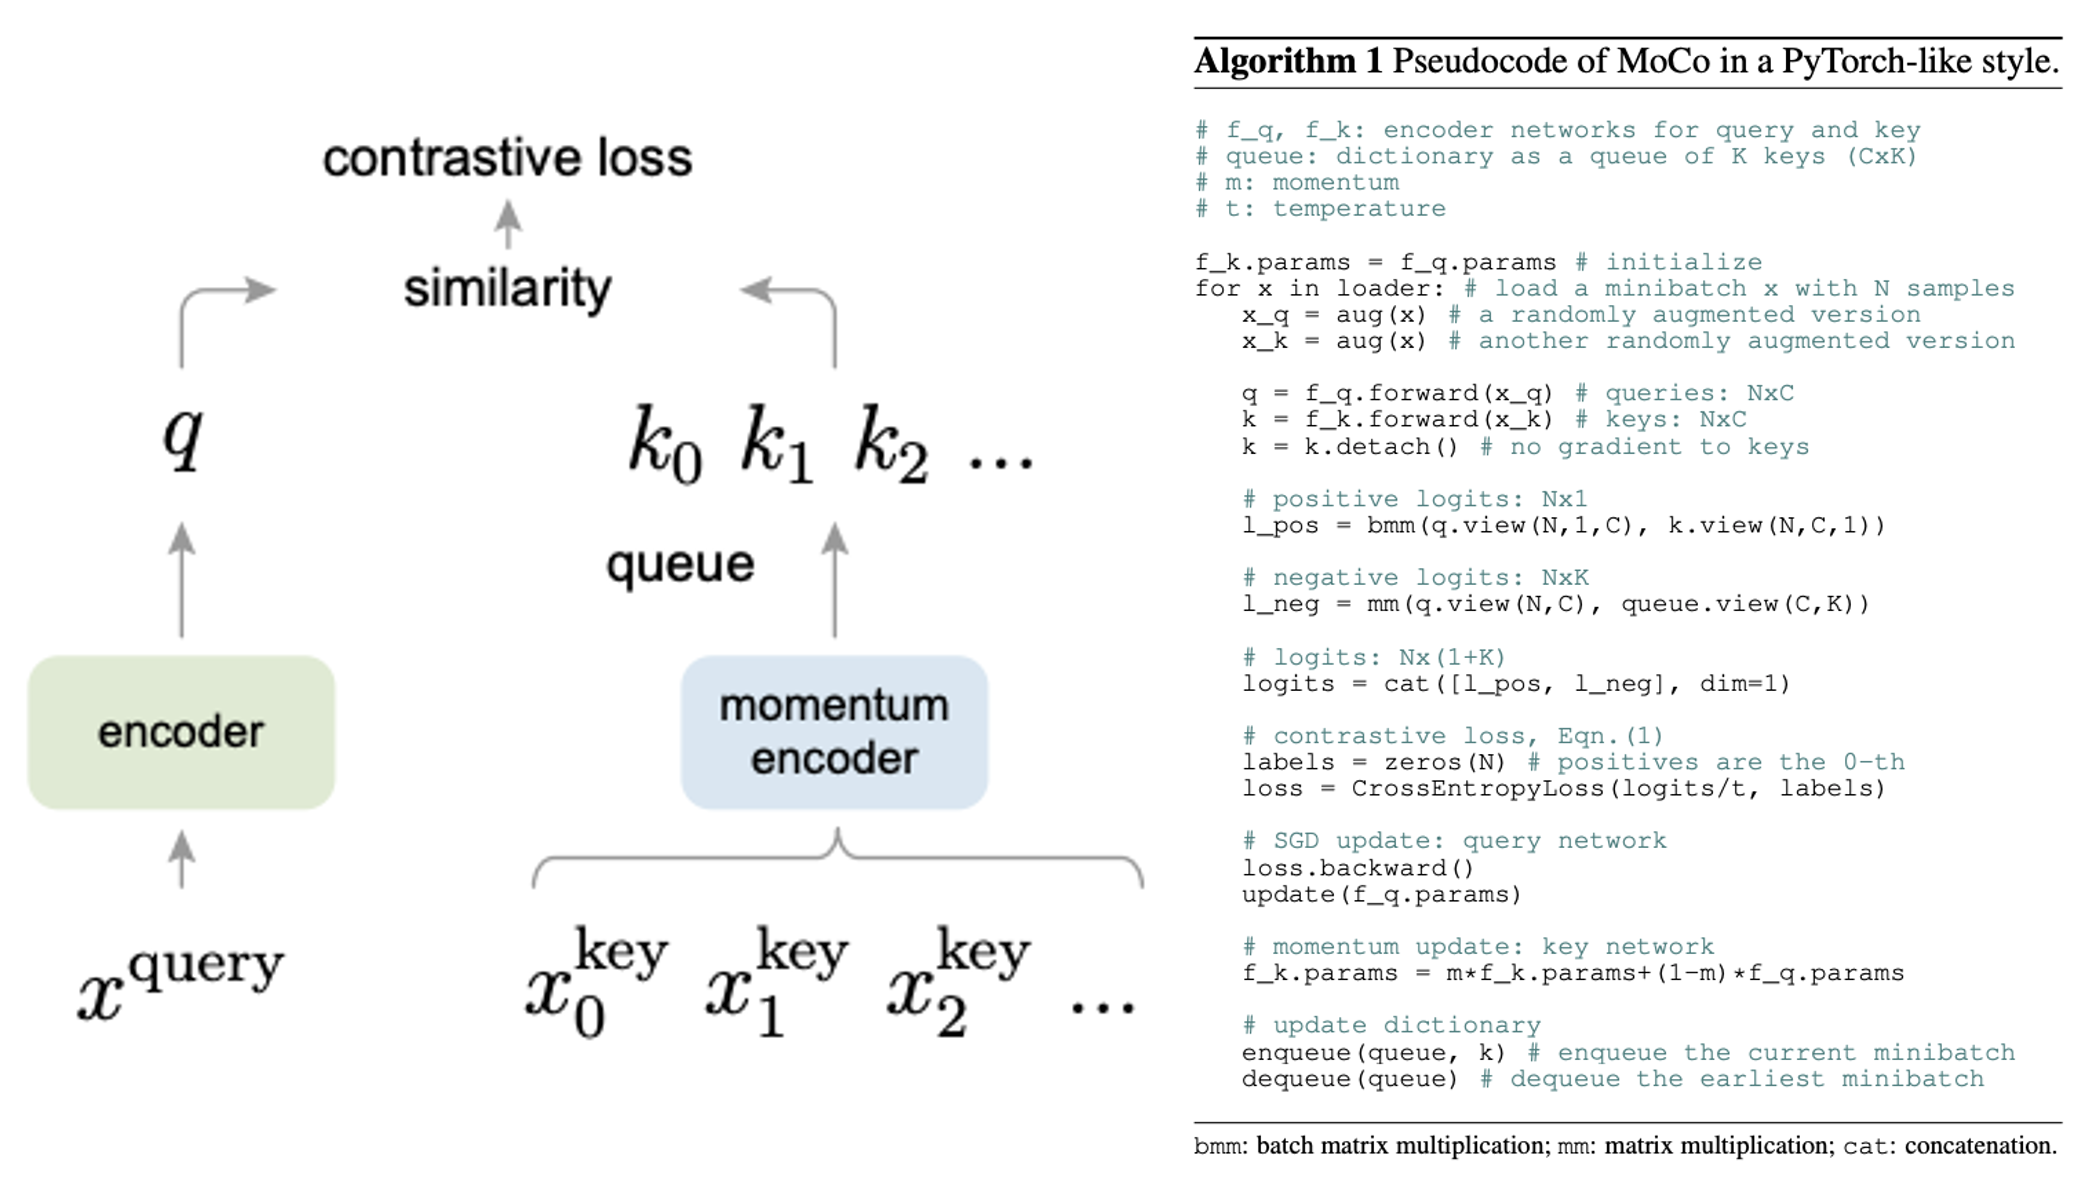
Background: Momentum Contrast for Unsupervised Visual Representation Learning (MoCo)
- Contrastive learning의 한 종류
- Large negative sample 학습을 위해 고안된 Facebook 진영의 SSL 방법론
-
는 momentum encoder for key, 는 main encoder for query
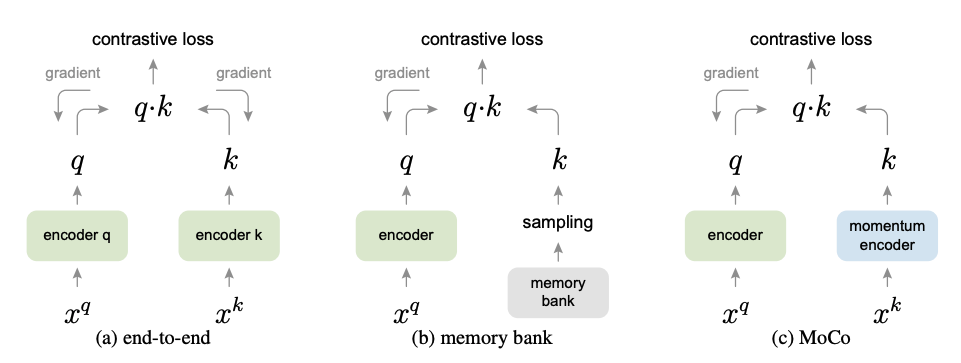
기존 방법들과 Moco의 차이.
(a) end-to-end: 하나의 batch 안에서 positive (1개)+ negative (batch-1개)
negative samples의 갯수는 batch size에 한정됨. negative sample을 늘리고 싶으면 batch를 늘려야하고 그럼 메모리 Bomb
(b) memory bank: 특정 N epoch마다 모든 sample에 대한 encoder의 feature값들을 저장해두고, sampling하여 negative sample을 얻는 방법. 모든 샘플에 대한 feature들을 미리 뽑아둬야 한다는 시간 소요 및 메모리 소요. 현재 인코더의 feature와 bank feautre 간의 시간 차이로 inconsistency.
(c) MoCo: Dynamic dictionary로 메모리 효율적. momentum update를 통한 inconsistency 최소화. encoder only gradient update로 학습 속도 빠름. 이를 통한 large negative sample 활용 가능.
다시 BYOL
- SimCLR은 Collepsed representation을 피하기 위해서 (공간을 나누기 위해서) negative를 정의하여 margin을 넓히는 방식을 채택
- Collepsed representation이란 모든 positive pair들이 모두 같은 점에 위치하는 문제.
- BYOL은 어떻게 data feature space를 학습하는가? 아직 의견이 분분
- 본 paper 안에서도 보면 ablation study로 이 실험을 하게된 intuition이 있음.
- 그냥 random init 한 linear probing 결과보다 BYOL을 한번 interation 한 모델의 결과가 10% 이상 성능 향상이 있었음.


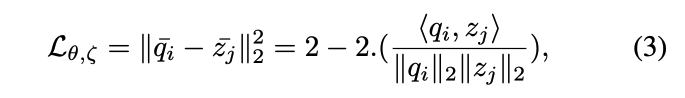
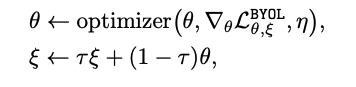
: Input data : Augmented data : encoder : projection header : predictor : Online (최종적으로 취하고자하는 모델 ) : target (Online을 천천히 흡수하는 모델)
Swapping Assignments between views (SwAV): Cluster based
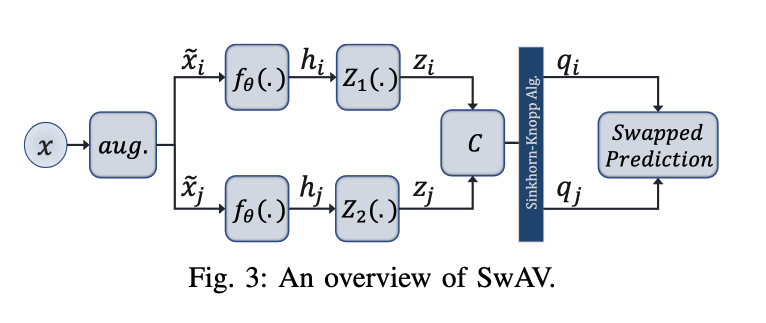
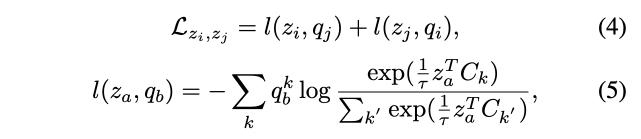
- 서로 같은 에서 나왔다면 그로부터 생성된 를 통해서 서로를 예측할 수 있어야한다.
B. Datasets
| Attribute | PTB-XL | Chapman | Ribeiro |
|---|---|---|---|
| Number of Subjects | 18,885 | 10,646 | 827 (test set only) |
| Number of Samples | 21,837 | 10,646 | 827 (test set only) |
| Sampling Frequency | 100 Hz | 500 Hz | 400 Hz |
| Duration of Records | 10 seconds | 10 seconds | Unspecified |
| Age Range of Participants | 0-95 years | 4-98 years | 16 years to over 81 years |
| Gender Distribution | 52% male, 48% female | 56% male, 44% female | 61.2% female |
| Key Features | Utilizes 12-lead ECG, multiple labeling categories (Diagnostic, Form, Rhythm), data collected between 1989 and 1996 | Includes ECG signals with arrhythmia and other cardiovascular diseases, well-pre-processed for consistency | Focuses on diagnosis of specific abnormalities, data is biased towards female patients |
C. Implementation Details and Evaluation Protocol
-
Data Division:
- PTB-XL and Chapman datasets were divided into training, validation, and testing portions. PTB-XL used a predefined division of 10 subsections, with 8 for training, 1 for validation, and 1 for testing.
- Chapman was divided randomly, assigning 80% of samples to training, 10% to validation, and 10% to testing.
- Ribeiro was used solely for fine-tuning/testing, not for pre-training, with its test set further split into training (80%), validation (10%), and testing (10%).
-
Data Preprocessing:
- Chapman and Ribeiro datasets were downsampled to 100Hz to match the PTB-XL sampling rate for consistency.
- Signals were segmented into 2.5-second intervals with no overlap, resulting in segments of 250 data points each.
-
Model Training:
- During the pretraining phase, models were optimized using NT-Xent loss, selecting the best model based on the lowest validation loss.
- In the fine-tuning phase, binary cross-entropy loss was used, and models were selected based on the highest F1 score on the validation set.
- The contrastive phase is trained for 2000 epochs with a batch size of 4096 for SimCLR and BYOL, and a batch size of 1024 for SwAV due to computational resource constraint
-
Computational and Software Resources:
- Models were implemented using PyTorch.
- Training utilized NVIDIA GeForce GTX 2080 GPUs.
- Adam optimizer was employed with specific learning rates for pretraining (5×10(^{-4})) and fine-tuning (5×10(^{-3})) to prevent catastrophic forgetting.
-
Model Architecture:
- The xResNet1d50 model, an adaptation of the ResNet50 model for 1-dimensional data, was used as the backbone for all experiments.
-
Evaluation Metrics:
- Performance was primarily evaluated using the macro F1 score, which assigns equal weight to each class, providing a fair metric for imbalanced datasets.
-
Augmentation Techniques:
- Several augmentations were applied to enhance model training, including Gaussian noise, channel scaling, negation, baseline wander, electromyographic noise, masking, and time warping.
- Specific parameter sets were tested for each augmentation type based on prior research.
- To further understand the effects of various augmentations on model training, multiple augmentations were combined in some experiments.
- Four augmentations were randomly selected in each iteration of pre-training to maximize performance.
D. Augmentation detail
는 본문 6page 참조
E. Data Distribution
-
Purpose of Distribution Analysis:
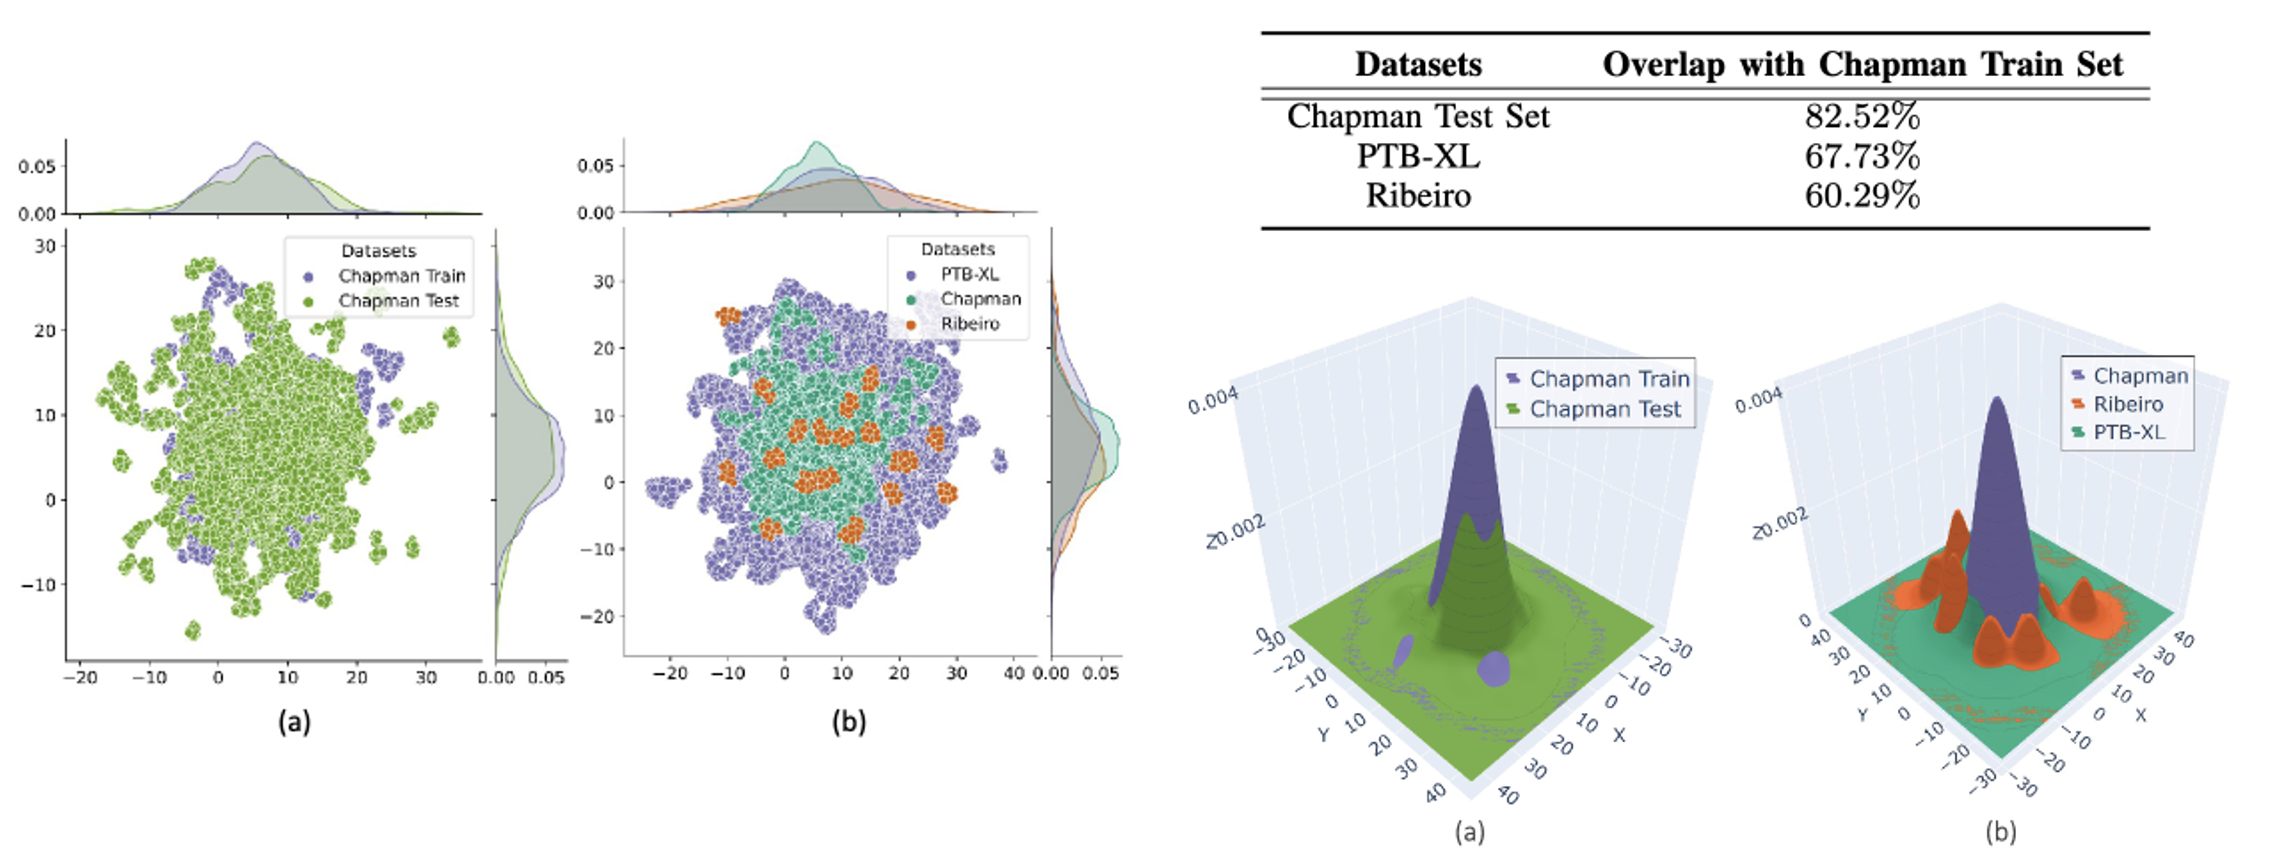
- The goal is to examine how similar or different the datasets are from each other in terms of their underlying data distributions. This analysis helps determine whether the datasets can be considered as in-distribution (ID) or out-of-distribution (OOD) relative to one another.
- The goal is to examine how similar or different the datasets are from each other in terms of their underlying data distributions. This analysis helps determine whether the datasets can be considered as in-distribution (ID) or out-of-distribution (OOD) relative to one another.
-
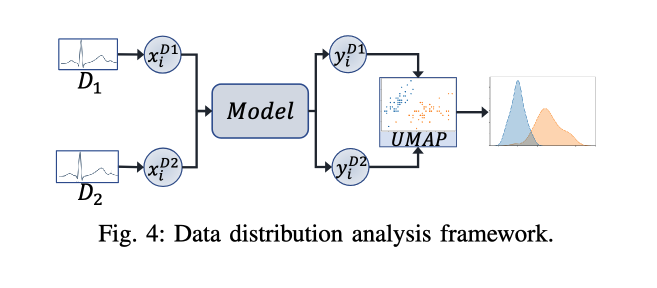
Methodology for Distribution Analysis:
- A pre-trained model is used to process samples from each dataset to generate outputs that reflect the dataset’s characteristics.
- Dimensionality reduction, specifically using Uniform Manifold Approximation and Projection (UMAP), is applied to these outputs to reduce the complexity of the data while preserving the relationships essential for understanding distribution similarities.
-
Parameters for UMAP:
- UMAP is configured with a number of neighbors set to 30 and a minimum distance of 0.25 to perform the dimensionality reduction effectively.
-
Analysis Framework:
- The framework involves generating and analyzing two-dimensional embeddings of the datasets using UMAP. This visualization helps in observing whether the embeddings of different datasets overlap (indicating ID) or are distinct (indicating OOD).
-
Quantitative Analysis:
- The overlap between the data distributions of different datasets is quantified using the overlapping index (η). This index measures the degree of overlap between the probability density functions (PDFs) estimated from the UMAP embeddings of the datasets.
- The overlapping index is calculated through an integral that quantifies the minimum overlap area under the curves of the two PDFs, which provides a numerical value representing the similarity between datasets.
-
Implications of Findings:
- Understanding whether datasets are ID or OOD with respect to each other is crucial for evaluating the generalizability of models trained on these datasets.
- It helps in predicting the performance of models when they are applied to new, unseen datasets and in developing strategies for training more robust models.
4. Results and Discussions.
A. Data Distribution Analysis
-
Showing different Distribution ID and OOD
- (a) In-Distribution: SSL feature distribution (같은 데이터셋의 test dataset)
- (b) Out-of-Distribution: SSL feature distribution (다른 데이터 셋)
-
어떤 Dataset으로 SSL을 하든 Rebeiro dataset든 특히 다른 분포를 보이고 있음을 확인함.

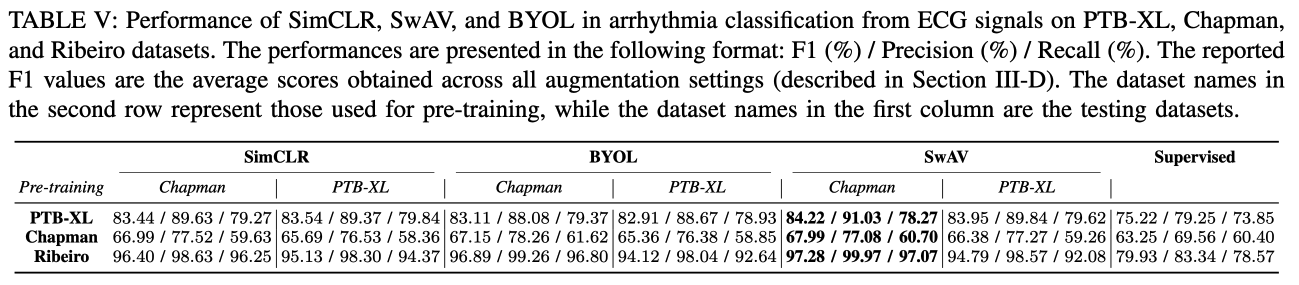
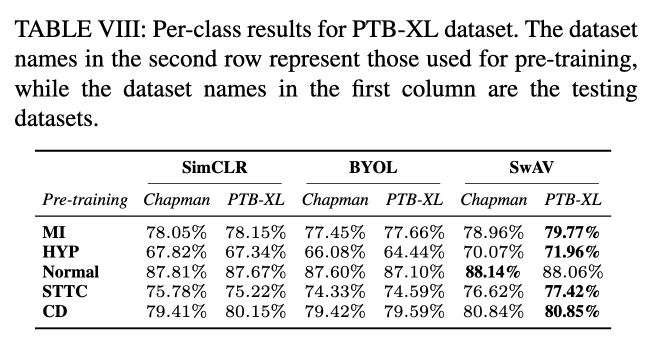
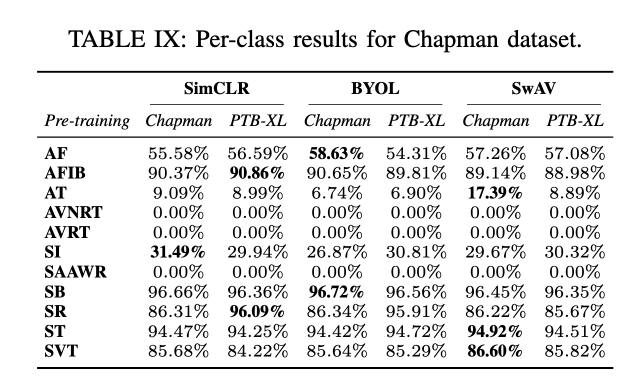
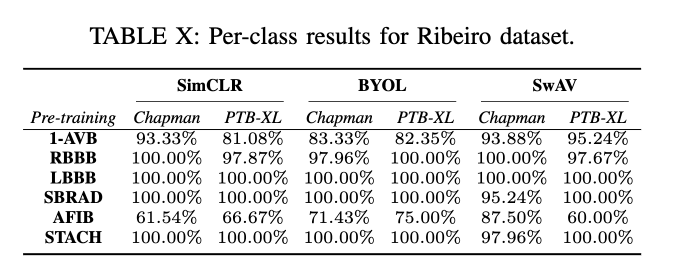
B. SSL Method Performance

- Data augmentation들의 조합 실험들 평가 결과를 평균한 것.
Conclusion
-
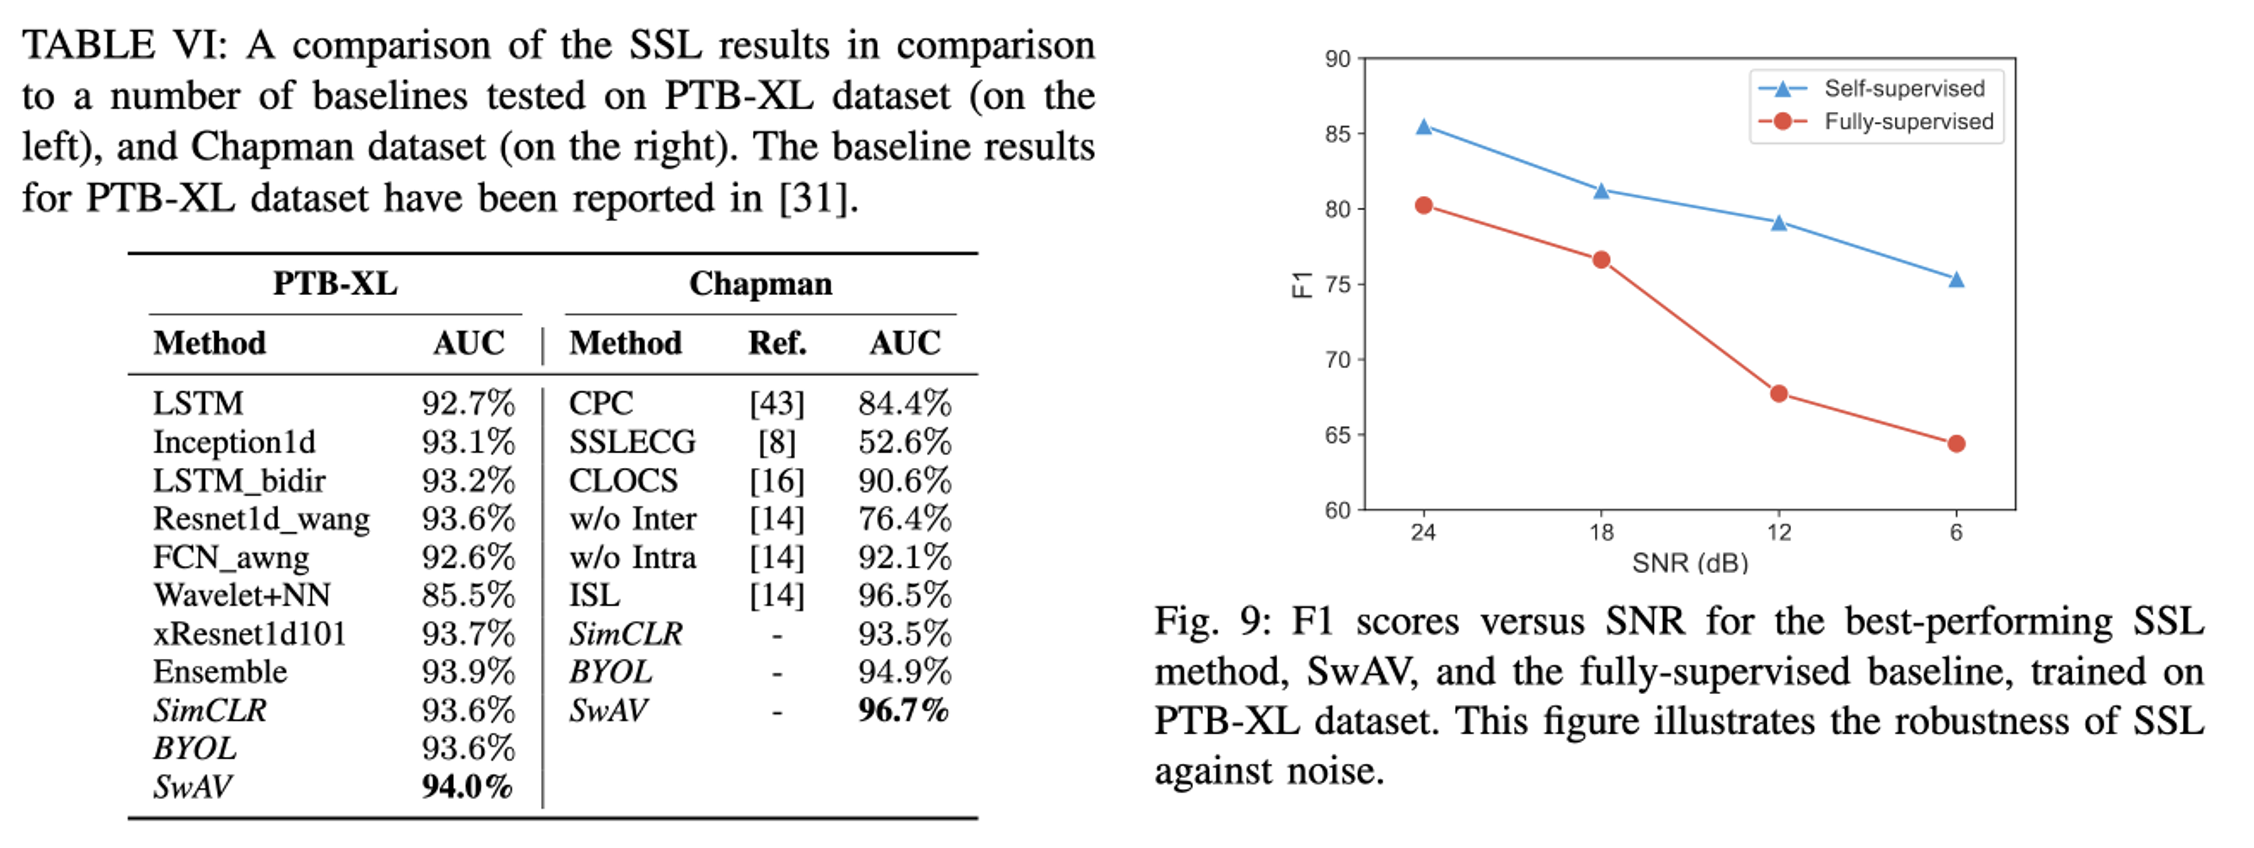
Effectiveness of SSL Techniques: The study confirms that SSL methods are highly effective for arrhythmia detection from ECG signals, demonstrating competitive or superior performance compared to traditional supervised learning methods.
-
Performance Across Datasets: SSL techniques showed robust generalization capabilities across multiple datasets, with SwAV particularly noted for its superior performance in both in-distribution (ID) and out-of-distribution (OOD) settings.
-
Influence of Augmentation Techniques: The study highlights the significant role of augmentation techniques in enhancing the learning process. Specific augmentations such as dynamic time warping and masking notably improved the SSL models’ ability to generalize and detect arrhythmias accurately.
-
Data Distribution Insights: Analysis using UMAP revealed important insights into the data distribution characteristics of different datasets, influencing the SSL model training and testing strategies and helping in understanding the generalization across ID and OOD scenarios.
-
Implications for Clinical Application: The findings underscore the potential of SSL methods in practical clinical applications, where they can be used to enhance the accuracy and efficiency of ECG-based diagnostics without the need for extensive labeled datasets.
-
Future Directions: The conclusion may suggest areas for further research, such as integrating more complex or larger datasets, exploring other SSL algorithms, or applying the findings to other types of biomedical data.